This short post is to share that a new update of the Hypothesis Tests Visualised Project is out! At the bottom of this post, you’ll see a summary of all the major updates made. Most significantly, I have finished three new exercises:
- 1-sample z-test
- t-curve motivation
- 1-sample t-test
As a reminder, you can view the project here: https://thomaselton.shinyapps.io/hypothesis-tests-visualised/
Through my attempt to help students conceptually understand hypothesis testing, I am exploring different teaching methods. I am sharing these below to document my journey in trialling different techniques.
Technique 1: Guiding Example
When introducing the project (here), I mentioned that “on the top right-hand portion of the screen is a button that students can press, which will bring up some additional information motivating the topic being discussed.” One of the big aims of this exercise was to ground each exercise with context so that students could easily see the relevance and motivation behind the exercise.
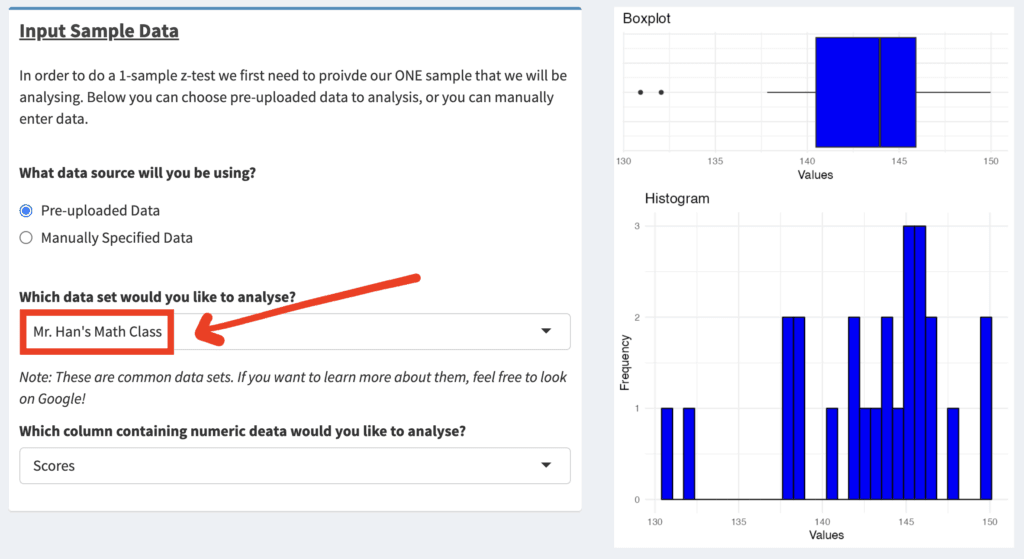
I took this a step further with the 1-sample z-test and 1-sample t-test. For these exercises, I present a specific example that can be answered using the hypothesis test the respective exercise explores. As seen in the image below, the guiding example for the 1-sample tests is about a statistics teacher named Mr. Han who wants to investigate whether his students receive a higher average grade than some set threshold.

Doing this helps the student understand the type of question that can be answered using each hypothesis test whilst simultaneously engagingly introducing the topic.
To encourage active learning, the textual description starts the student off but doesn’t reveal the final answer. The student is encouraged to continue using the app to tell Mr. Han whether his students statistically received a higher average grade or not. Students can do this by setting their data sample to be ‘Mr. Han’s Math Class’.

Technique 2: Connecting the Dots
When teaching t-tests, I worry that students do not understand why we have introduced this new distribution called the t-distribution. I wanted to connect the dots between the 1-sample z-test and 1-sample t-test by introducing an intermediate exercise.
This exercise, named ‘Introducing the t-Distribution (Motivation)’, explains the shortcomings of the z-test when one of the key assumptions is not met and how we can instead use the t-distribution to address this shortcoming. This is a good way to connect the dots between the z and t-tests while helping students expand their conceptual understanding of the t-distribution.
To encourage active learning, small interactive widgets are imbedded. The image below shows how text is broken up with an example widget to promote active learning and build deeper conceptual links with the content.

Summary of Major Additions/Changes to the Project:
- Each exercise (page) falls under larger categories.
- ‘The Box Model’ exercise now has a submit button when specifying the manual tickets. This is to increase performance.
- ‘1-Sample z-test’ exercise created.
- ‘Introducing the t-Distribution (Motivation)’ exercise created.
- ‘1-Sample t-test’ exercise created.

